I can’t find any focusing distance slider. I’m on windows and the manual says it should appear automatically but doesn’t mention when and where.
George
I can’t find any focusing distance slider. I’m on windows and the manual says it should appear automatically but doesn’t mention when and where.
George
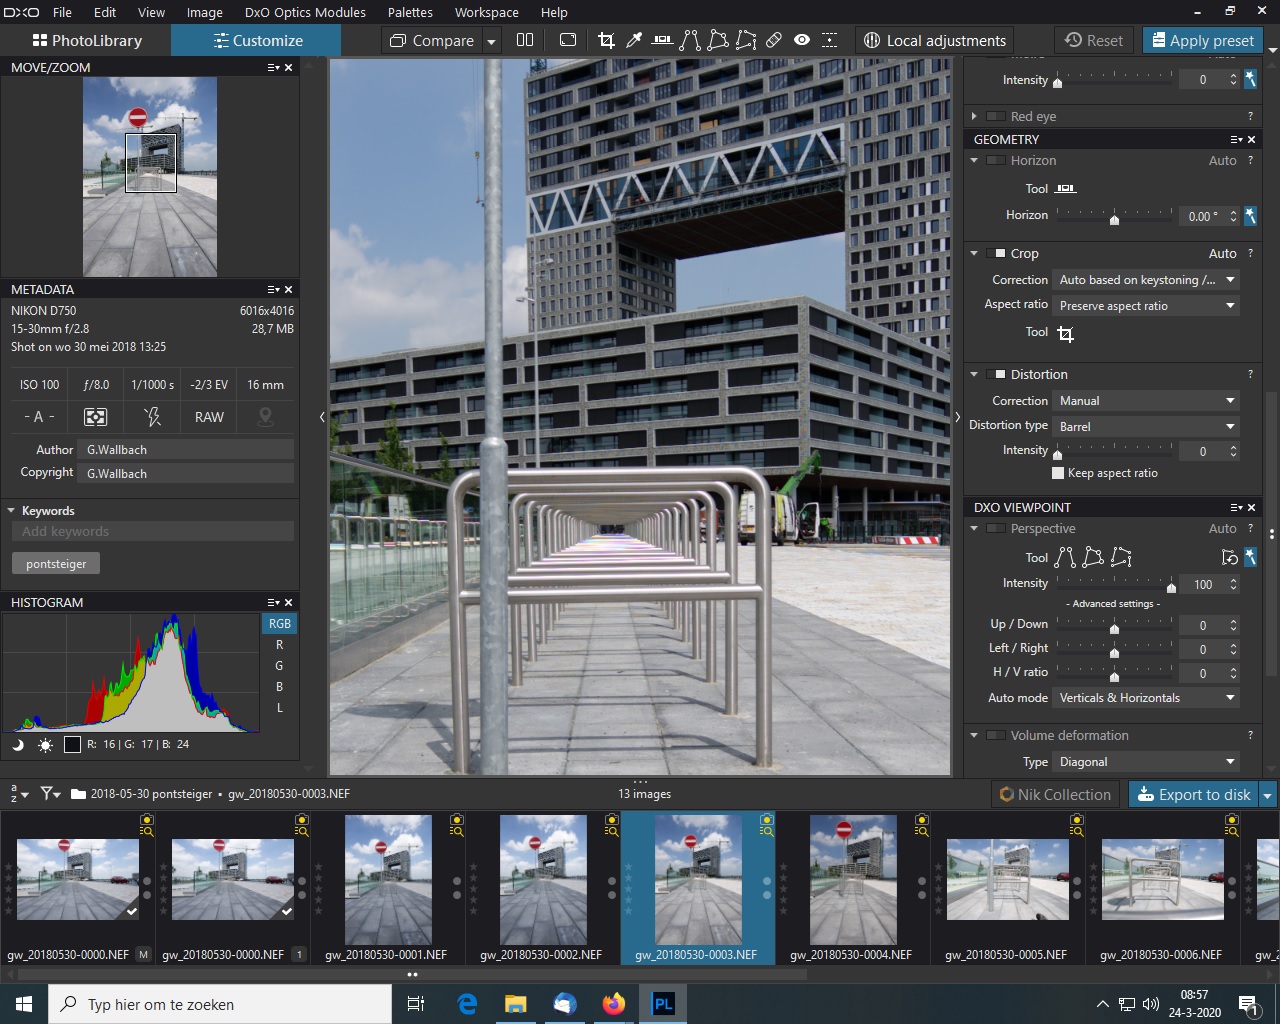
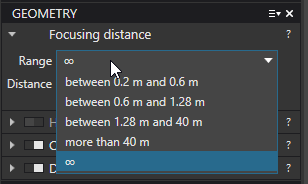
It appears automatically in Geometry palette right after the module download but only in case Focusing distance is not properly specified in Exif data:
Regards,
Svetlana G.
@George, can yo see the tool when you edit your workspace, e.g. add a palette and click on its hamburger menu?
No, I can’t see it. And lost the slider with focal length. If it depends on the image, I lost a lot of time searching for something that isn’t there. I think the interface of dxo is horrible, also
of dxomark. I know they are separated.
Here is a screenshot. With a keyword 
Dear George,
First, as I see you’ve got an unresolved module ambiguity (yellow icon) -> as the result the module is not applied yet - unless you select it manually.
And as I have already said above this sub-palette only appears when there is a problem with autodetection -> so in most cases you just don’t need Focal length or Focusing distance as they are properly written in Exif and detected by the application.
Regards,
Svetlana G.
…so the windows version really differs from the Mac version. If I were to choose, I’d prefer the non-automatic approach (also for lens modules) over the automatic one. Being in control is something that I like in the creative process. Being in control also allows me to do things outside of the box.
Hello @platypus,
Please, correct me if I’m wrong, but for most images you’ve got these sub-palettes disabled, isn’t it?
And this is the only difference with Win - we hide them, MAC disable them.
Regards,
Svetlana G.
The modules were applied but it seems that another module was available.
That’s what I meant: I was spending time searching for something that wasn’t available and visible for me. That’s a fault in the interface of dxo…
@Mike
The histogram represents the appearance of different pixel values. It’s a tool that helps you but it doesn’t give you exact info. It’s not meant for that. The most used use is that for exposure. I’m only interested in the space there is left on the right side.
If the horizontal ax represent the pixel values 0 -255 and the vertical ax the amount then one could say that the surface of that diagram would represent the total amount of pixels. Go through your images and you will find different sizes of the surface, especially when ther is a large peak. This is caused by the fact that the range of the horizontal ax is fixed, 0-255, but the range of the vertical not. The highest value determines the range and so the representation of that diagram.
George
Regards,
Svetlana G.
George - Are you aware that you can define a layout that suits your specific requirements?
See here for more info …
John M
@sgospodarenko
My installed modules. There’re two Tamron SP 15-30 modules, 1 in use and not removable and the other removable so not in use. I removed the not in use one and everything is ok now. I think this happend with the PL3 install. The pictures are from 2018.
@John-M
Yes, I read. I just wasn’t sure those double tools were the same. But it doesn’t solve the problem of communication: different menus, different visible sliders, different tools. It’s like reading a book with different and hidden chapters.
George
Hello,
I agree with George. I’ve seen a lot of videos explaining how to work with DXO, most of them based on MAC OS. Sometimes I’ve wonderd because I can’t find parts of the tools which has been explained.
So for long time I ignored this working with the things I find 

…i basically use two different workspace setups.
One of them has grown over time and puts tools into palettes that only loosely relate to DxO’s original setup. I grouped them according to what I almost always use, what I often use and what I rarely use as well as all the rest. This allows me to collapse the palettes in order to work with as little scrolling as possible.
The other setup is called All-In and groups tools in two palettes only (left and right) This is my usual testing setup and is easy to extend when new tools come up.
You can say that I disable the palettes, I get access to all tools nevertheless.
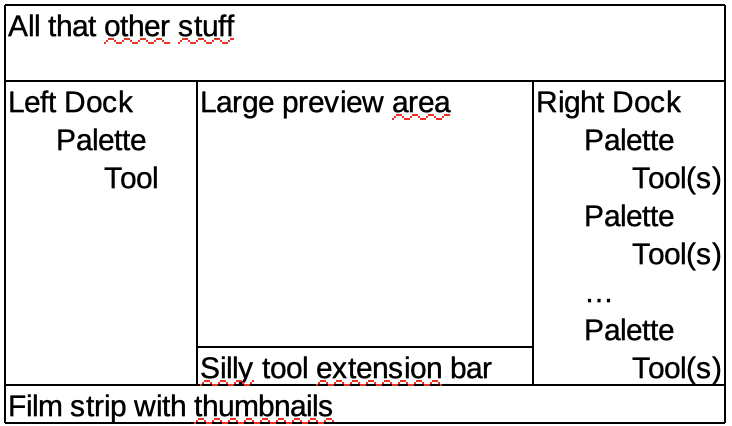
To clarify terminology, I use this wording:
Get all the details out of this:
Archiv.zip (3.8 KB)
If I could just return to the original topic/question, I now understand that the histogram will not reflect a zoomed view but will a cropped view. However, after editing, the histogram does change when a view changes, making it inconsistent. This was checked and verified by @platypus too. So, this is a bug, right? The original questions are still outstanding;
The histogram reflects the picture. Zooming does change the content of the viewing window but doesn’t change the picture. Cropping does change the picture, so the histogram.
I can’t reproduce your observation. But moving through my filmstrip, changing the actual image, I see the histogram changing with a delay. I think that’s normal. The new image has to be computed first before the histogram can be calculated.
Don’t overestimate the histogram. It shows you what you see in a different way. It’s used to see what space you have for exposure, together with clipping tools it shows you where the clipping is. It can show you the influence of your editing, others may tell more about that.
I couldn’t find it in pl3 but another use of the histogram is selecting another range as 0-255, by example 5-250. That’s important when printing.
I can’t reproduce your observation so I can’t give an answer.
George
I am fairly sure that we had a thread about the behaviour of the histogram palette.
Highlight clipping , shadow clipping, color saturation warning colors, RGB numbers following your mlusepointer.
We talked about rawdigger and the difference in that of clipping moment.
Me personal would like a few things working different.(could be inhere but i don’t know it then)
1 i think there are toggle keys to activate/deactivate clipping warning but a blinking (0,5sec?) version wil be better because now some warningcolors are looking as bin a imagepart unless you turn off the warning and it disapeers.
2 the image tonecurve visible in the histogram image, this way you can see the effect of contrast and exposure adjustments on a luminance level. Or one of the colors.
3 then you need also a crossline target which follows your mousepointer on the histogram, so you can point in the image a problem area which you can see in the histogram and by clicking the channels you can see which channels are creating that issue.
4 to be more precise it should be a toggled mode for floating and back to original place and a possiblity to make it bigger in view.( i think i would like a floating copy, twoscreen worker, which popped up if i activate the extended toolset. (advangedmode so to speak.)
All this can also be fitted in a seperate tool to preserve computingpower , just activate as you need it.
Contrast and tonality and thus colorprofiles are effecting the visuals on the histogram because it represent the channels of the rgb colorspace in the DxO preview not the actual histogram of the raw data.
Because of this i can utilize this fact better if it’s also computing the other adjustments which effects the histogram visual graphics. By overlaying the tonecurve and let the tonecurveform be changed by the tone and contrast controls you can see where the contras balance is shifting to while watching the effect on the channels in one window. And same for the tone sliders.
Now it shows only in the channel graphics a change but not in the actual tonecurve/tonality of the image. (finaly i point to the color control tools of davincy resolve which is a color grading tool to show you that there are more ways to visualize a rgb channel data.) The good old histogram is a bit rudimentair which is good on your camera but less good when you want a more detailed information level.

Thank you. I agree with your thoughts, although you are probably proposing a few things things beyond my needs at this point in time. I do use the sliders and the histogram in editing, as the sliders on their own are limited.
I understand more of the workings of the PL3 histogram now but still don’t have an answer to why after editing an image, I can change the view and, on returning, see a slightly different histogram. I don’t think I am going to get an answer to that and will just assume it is either a bug or a long delay that gets executed immediately on a view change. The work around is to change view to see what the histogram really looks like which, of course, is doable but frustrating. It can’t be the way it is intended to function.
Thanks for your input. A delay could be the answer. Changing view seems to force it request to the top of the queue. I hoped there might be a better answer, though.
… or possible inaccuracies in the calculation !
Pascal